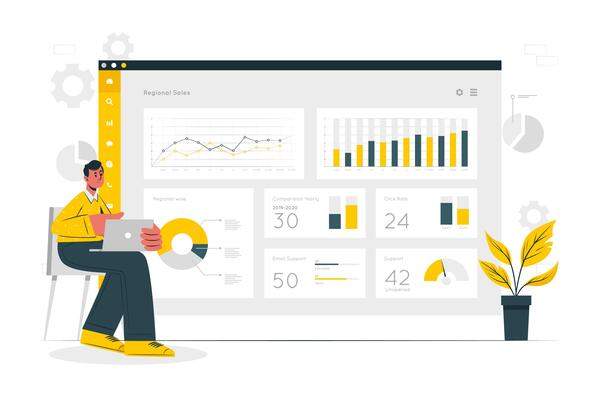
Data Dashboards
Data Dashboards
Data visualization and dashboards are essential tools for businesses that want to gain insights from their data quickly and easily. Data visualization is the process of presenting data in a visual format, such as charts, graphs, and maps, to help users understand complex data sets more easily.
Dashboards, on the other hand, are customized visual interfaces that provide users with real-time, interactive data visualizations, allowing them to monitor key performance indicators (KPIs) and make informed decisions.

By leveraging data visualization and dashboards, businesses can gain a deeper understanding of their operations, identify trends and patterns, and quickly respond to changes in the market.
Data dashboard should display information that is relevant to the specific audience and should serve the purpose it was designed for. We keep our dashboards simple and focused on displaying only the most critical information.
With our expertise in data visualization and dashboard development, we can help businesses turn their data into actionable insights, enabling them to make informed decisions and stay ahead of the competition.
Subscribe to our newsletter
…. for news and updates
