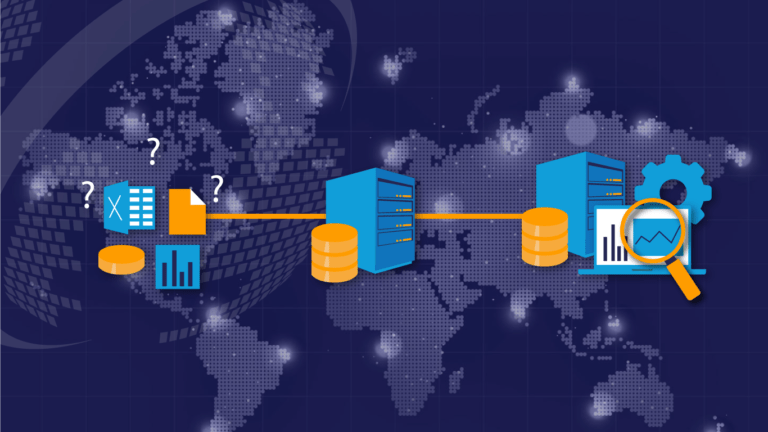
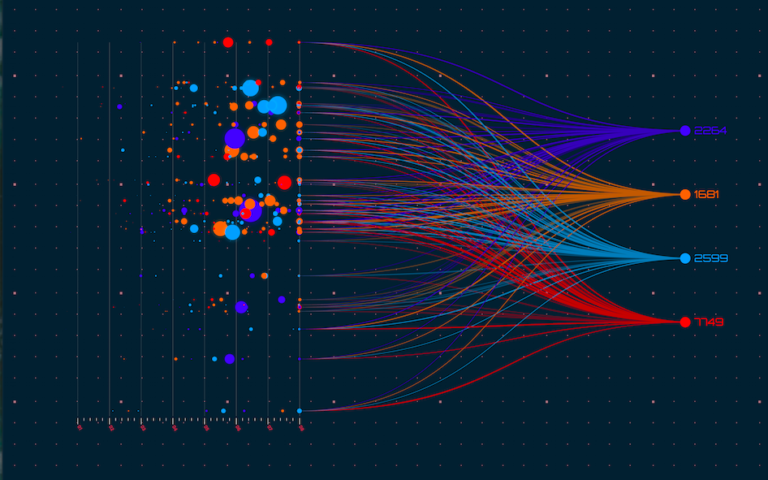
Data is essential to understanding your business and making informed decisions. But raw data can be difficult to understand and interpret, which is why data visualization is such a powerful tool. In this blog post, we’ll take a closer look at data visualization, why it matters, and how businesses can use it to turn their data into insights.
What is Data Visualization?
Data visualization is the process of turning raw data into visual representations that are easier to understand and interpret. This can take many forms, from simple charts and graphs to more complex interactive dashboards.
The goal of data visualization is to help people see patterns, trends, and relationships in data that might not be immediately apparent when looking at rows and columns of numbers.
Why Does Data Visualization Matter?
Data visualization is an essential component of any data analytics and business intelligence strategy. Here are a few reasons why:
- Improved understanding: Data visualization makes it easier to understand complex data sets by turning them into visual representations that are easier to interpret.
- Enhanced communication: Data visualization provides a common language for communicating insights and ideas to stakeholders, making it easier to collaborate and make decisions.
- Increased engagement: Data visualization is more engaging than raw data, which can help increase engagement and interest in data-driven insights.
- Better decision-making: By making it easier to understand and interpret data, data visualization can lead to better decision-making and improved business outcomes.
How Can Businesses Use Data Visualization?
Data visualization can be used in a variety of ways to turn raw data into actionable insights. Here are a few examples:
- Performance tracking: Data visualization can be used to track key performance indicators (KPIs) and identify areas for improvement.
- Customer insights: Data visualization can be used to understand customer behavior and preferences, allowing businesses to create more personalized experiences.
- Operational efficiency: Data visualization can be used to identify inefficiencies and bottlenecks in business processes, allowing businesses to optimize their operations and reduce costs.
- Risk management: Data visualization can be used to identify potential risks and threats to a business, allowing businesses to take proactive measures to mitigate them.
Conclusion
Data visualization is a powerful tool for turning raw data into actionable insights. By making data easier to understand and interpret, businesses can make better decisions, improve operational efficiency, and gain a competitive edge in their industry.
At DigitSilo, we specialize in data visualization and other data analytics and business intelligence services. Contact us today to learn more about how we can help you turn your data into insights.


