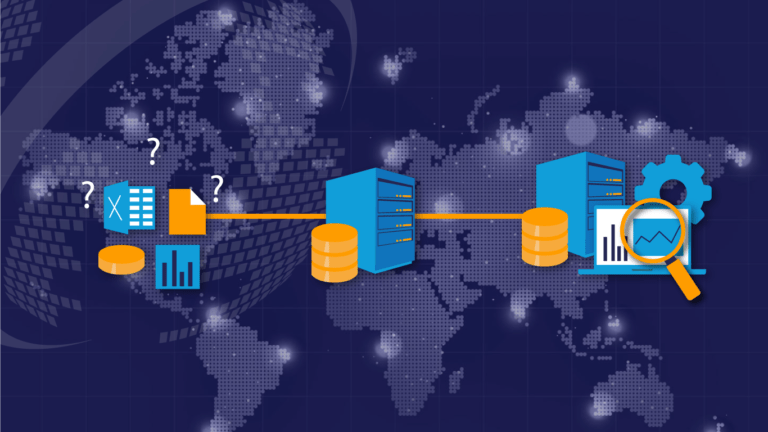
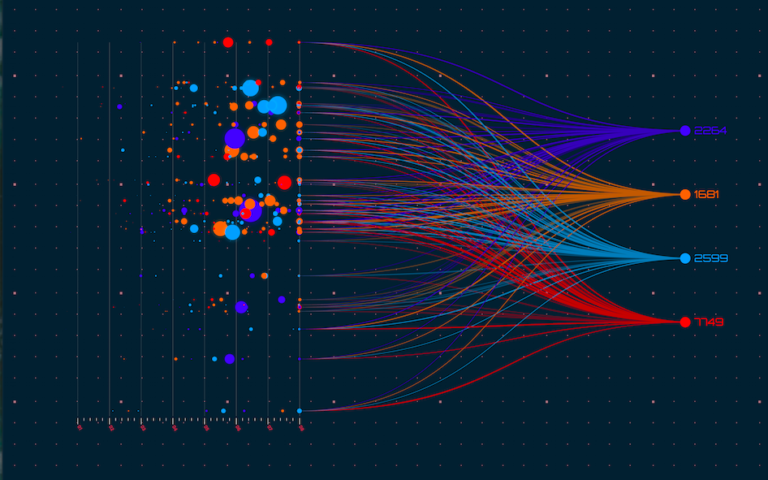
In today’s data-driven world, it’s more important than ever to be able to make sense of the vast amount of data at your disposal. But simply collecting data isn’t enough – you also need to be able to effectively analyse and communicate your findings to others. That’s where data visualization comes in.
Data visualization is the graphical representation of data and information. It’s a powerful tool that allows you to quickly and easily identify patterns, trends, and outliers in your data. By transforming complex data sets into easy-to-understand visual representations, you can communicate your findings to others in a way that is clear, concise, and engaging.
Here are just a few reasons why you need to visualize your data:
- Visualization makes it easier to identify patterns and trends When you’re dealing with large data sets, it can be difficult to identify patterns and trends simply by looking at raw data. But when you visualize that data, those patterns become much clearer. With a quick glance at a chart or graph, you can see which variables are correlated, which ones are outliers, and where there might be opportunities for further analysis.
- Visualization allows you to communicate your findings effectively Data visualization is a powerful tool for communication. Instead of presenting your data in a dry, technical report, you can create engaging, interactive visuals that help your audience understand your findings in a meaningful way. This is especially important when you’re presenting complex data to non-technical stakeholders who may not have the same level of expertise as you.
- Visualization helps you make data-driven decisions When you’re dealing with complex data, it can be difficult to make sense of it all. But with effective data visualization, you can see the big picture and make data-driven decisions based on your findings. By presenting your data in a clear, easy-to-understand way, you can identify areas where improvements can be made, or opportunities for growth and development.
- Visualization allows you to spot errors and inconsistencies One of the biggest benefits of data visualization is that it allows you to quickly identify errors and inconsistencies in your data. When you’re dealing with large data sets, it’s easy to overlook small details that can have a big impact on your findings. By visualizing your data, you can spot those errors and correct them before they lead you astray.
- Visualization helps you tell a story with your data Data visualization is an art form as much as it is a science. When you’re creating visuals to represent your data, you have the opportunity to tell a story with that data. By using colors, shapes, and other design elements, you can create visuals that are engaging and memorable, and that help your audience connect with your findings on an emotional level.
In conclusion, data visualization is a powerful tool that can help you make sense of complex data sets, communicate your findings effectively, and make data-driven decisions. Whether you’re dealing with sales data, customer data, or any other type of data, effective visualization can help you identify patterns, trends, and outliers, and present your findings in a clear and engaging way. So if you’re not already visualizing your data, now is the time to start!

